


The first two posts in the Protein Quality Series established something important: the number on the Nutrition Facts panel — protein (g) — measures quantity, not quality. And under FDA guidance, quantity alone is not enough to calculate % Daily Value or support a protein content claim.
Which raises a more fundamental question: what actually makes a protein high quality in the first place?
What Amino Acids Actually Determine Protein Quality
Let's get into the science a bit. Proteins are built from amino acids. There are twenty in total, nine of which are classified as essential, meaning the body cannot synthesize them on its own. Therefore, they must come from food. When you eat protein, your body breaks it down into its amino acid components and uses them to build and repair tissue, produce enzymes, support immune function, and carry out hundreds of other processes.
The quality of that protein depends heavily on which amino acids are present, and in what amounts.
A protein source that contains all nine essential amino acids in proportions that match what the human body needs is considered a complete protein. Salmon, dairy, and whole soybeans are all examples of complete proteins; each contains the full suite of essential amino acids. But complete doesn't mean equivalent. Quality still varies meaningfully across these foods (even within the same food category), depending on how it was produced or prepared.
The Limiting Amino Acid Problem
Even when a food contains all nine essential amino acids, the relative amounts matter. If one essential amino acid is present in very low quantities, it limits how much protein synthesis the body can complete, regardless of how much total protein is available.
This is called the limiting amino acid. Think of it like a production line: the slowest station determines the output of the whole system.
The PDCAAS score, which we've covered in depth in earlier posts, is built around this concept. It compares the amino acid profile of a food protein to a reference pattern representing human nutritional requirements, identifies the most limiting amino acid, and uses that as the basis for the score. A food with a limiting amino acid that falls well below the reference will have a lower PDCAAS and therefore a lower quality-adjusted protein value, even if its total protein grams look high on the label.
Why Protein Digestibility Changes the Equation
Amino acid profile tells you what's in the protein. Digestibility tells you how much of it the body can actually access.
Not all proteins are broken down and absorbed with equal efficiency. Some are highly digestible, meaning the body can capture most of what's present. Others are less so. Fiber content, antinutrients like phytates, and the physical structure of the food can all reduce the proportion of protein that reaches systemic circulation.
This is why PDCAAS is calculated as:
Amino Acid Score × True Digestibility = PDCAAS
And why two foods with identical amino acid profiles can produce meaningfully different PDCAAS values if their digestibility differs.
Protein Quality in Real Foods with Real Data: Salmon and Soybean
As we always say, better food deserves better data, and this concept becomes clearer with real data. So, let's take a look at a few examples:
Seatopia Atlantic Salmon
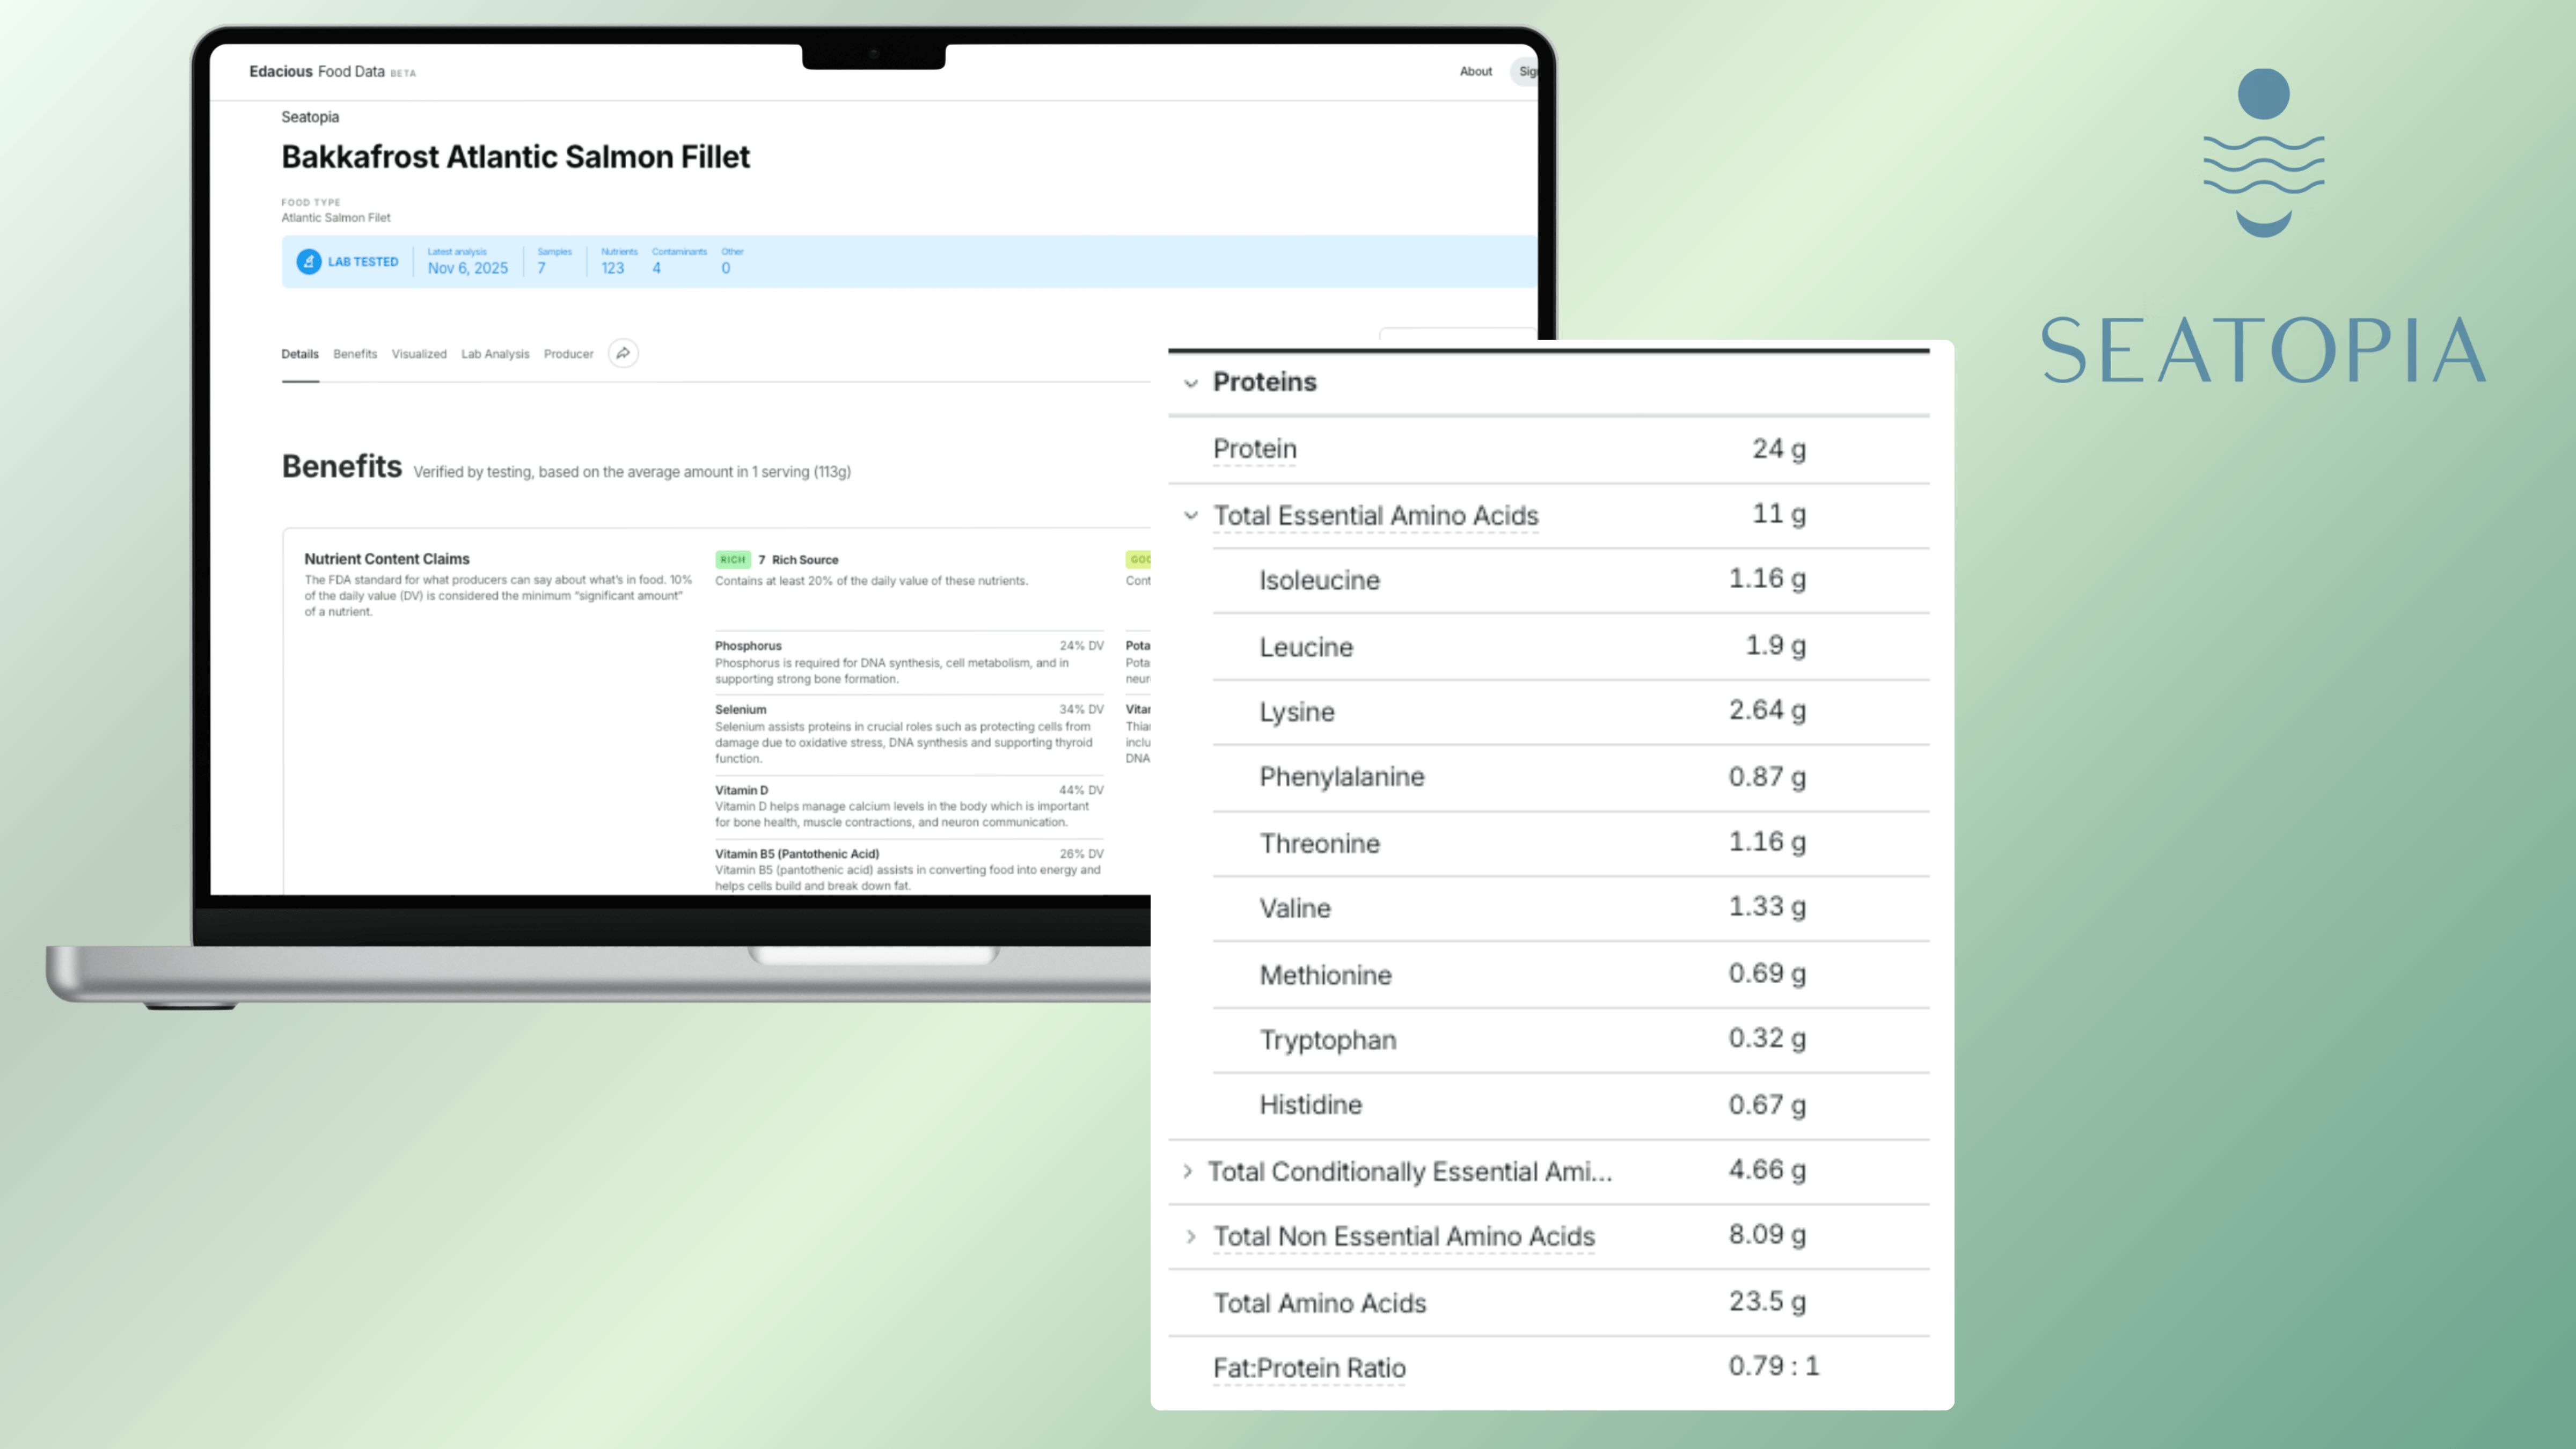
Bakkafrost Atlantic Salmon Fillet, available through Seatopia, and tested across 7 samples on the Edacious platform, averages 24 grams of protein per serving. This is 10% above farmed Atlantic salmon averages and 6% above USDA farmed benchmarks. But the gram count is only the starting point.
What verified testing surfaces beneath that number is the full amino acid composition: 11 grams of total essential amino acids, 4.66 grams of conditionally essential amino acids, and 8.09 grams of non-essential amino acids, totaling 23.5 grams of measured amino acids per serving. This is what "complete protein" actually looks like when the data is resolved beyond a single row on a nutrition label. The essential amino acid fraction alone — the nine amino acids the body cannot produce on its own — represents nearly half the total protein content.
The fat:protein ratio of 0.79:1 adds further context. Protein density doesn't exist in isolation from a food's broader nutritional composition. Understanding how fat and protein relate within a product is part of how complete nutritional quality gets communicated and compared. That relationship is why the platform surfaces it alongside the amino acid data, not as a separate metric but as part of the same picture.
Soybeans
The soybean is one of the few plant-based complete proteins containing all nine essential amino acids with relatively high digestibility compared to most legumes. But even here, verified testing tells a more precise story than averages suggest.
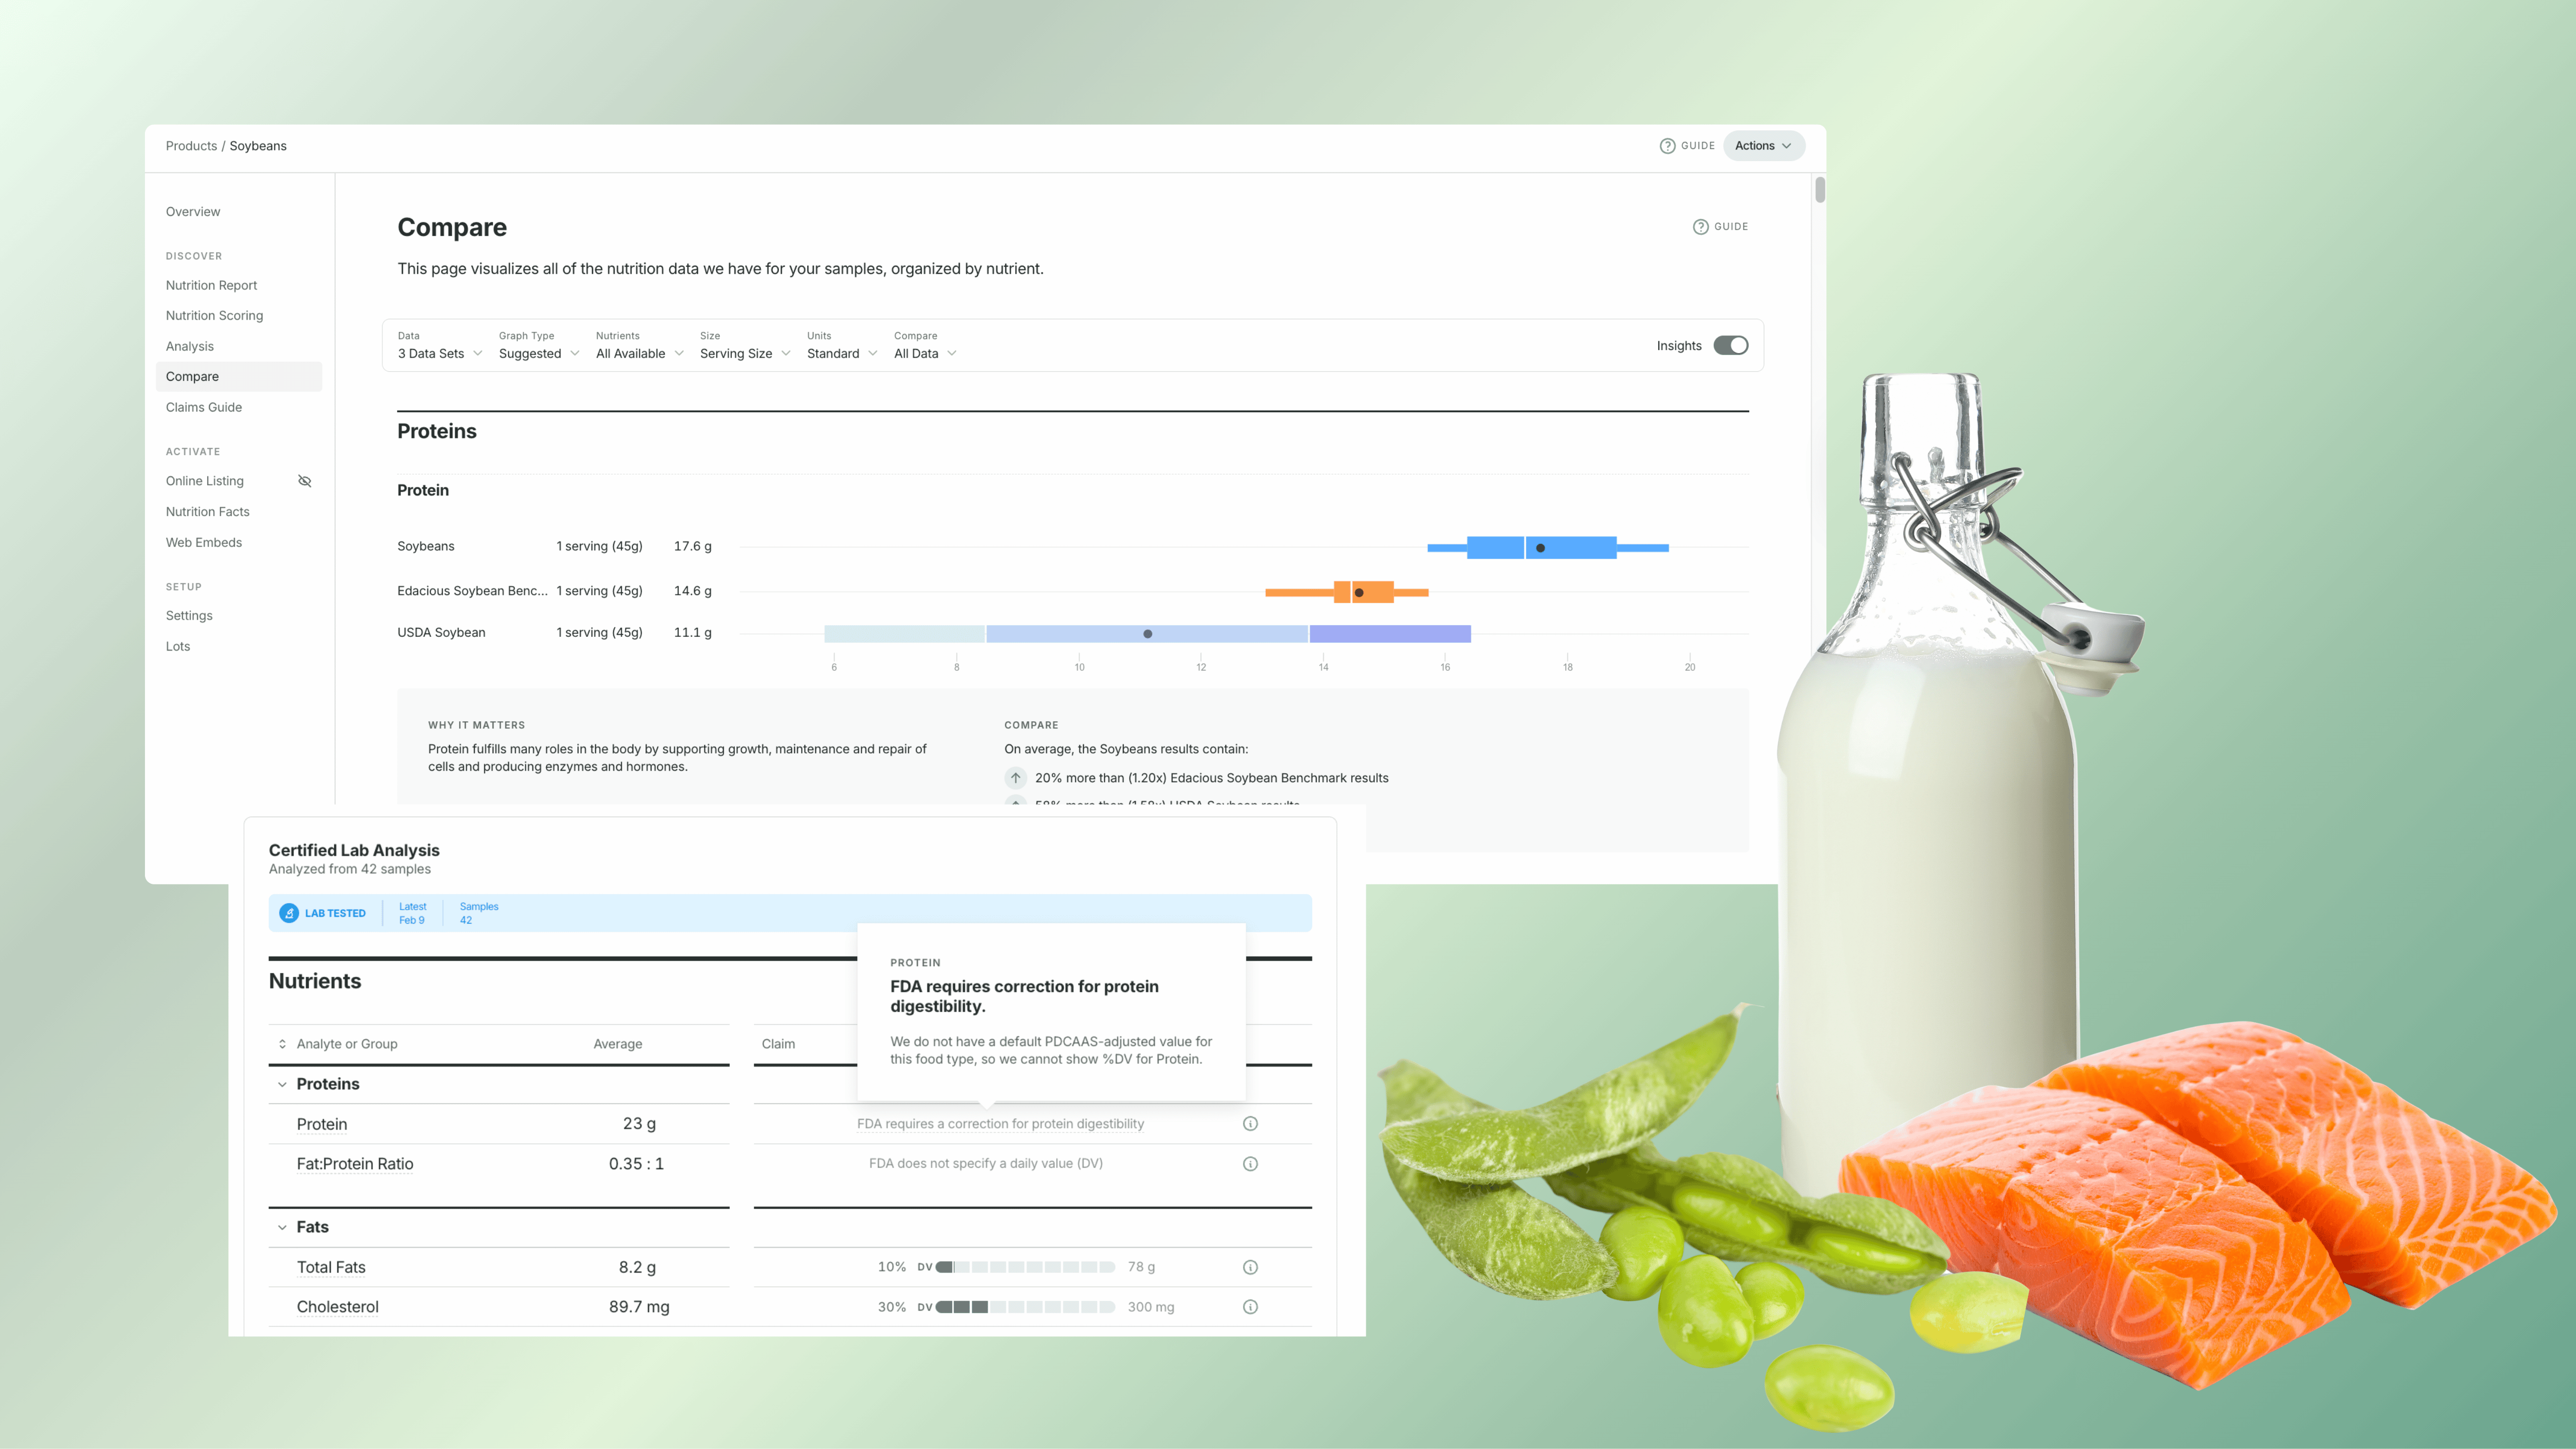
Soybean data from the Edacious platform illustrates the variability directly: tested samples show 17.6 grams of protein per serving, compared to the Edacious soybean benchmark of 14.6 grams and the USDA soybean average of just 11.1 grams. That's a 58% difference between what verified testing found and what the USDA database would have estimated.
For a producer making a protein claim based on database values alone, the gap between 11.1 grams and 17.6 grams is the difference between an under-supported claim and one that may actually be stronger than expected.

How Protein Quality Can Vary Within the Same Food
Protein quality is not fixed. It varies based on how a food is grown, processed, and prepared. The soybean data above illustrates variability across data sources. Variability also exists within a single food type across production conditions.
Preparation method matters for digestibility. Raw soybeans have measurably lower protein digestibility than cooked ones, as heat deactivates anti-nutritional factors that would otherwise reduce absorption. The amino acid profile may be identical; the usable protein is not.
For animal proteins, production practices influence amino acid composition in ways that can affect quality scores. While not dramatically, feed composition can also measurably shift amino acid profiles in fish and dairy. Which is precisely why testing the actual product, rather than relying on a database average, provides a more accurate basis for both understanding and claiming nutritional value.
From Quality Score to Label: What This Means for Your Product
Understanding protein quality at this level has real implications for how food products are positioned and labeled.
A brand whose salmon or dairy product has been tested knows what protein values their actual product delivers, not what a generic database estimates. For some, verified testing reveals that their product outperforms the category average, as the soybean data above demonstrates. For others, it identifies a gap that needs to be addressed before a claim goes to market.
Either way, the data doesn't just satisfy a compliance requirement. It becomes the foundation for a more confident, more defensible brand story.
The Protein Quality Series examines how protein quality is measured in real food — beyond total grams and marketing claims. We explore amino acid balance, digestibility, PDCAAS, and regulatory thresholds to clarify how usable protein is calculated, qualified, and communicated. Because when it comes to protein, quantity alone is not the full story.
.png)
.png)

