Fat Quality
How Feeding, Formulation, and Preparation Shape Fat Quality in Animal Protein
The nutritional composition of a product is the byproduct of dozens of decisions made long before a product reaches a package, and a total fat number is generated for a label. What the animal ate. How the product was formulated. How it was prepared. Each of those decisions shapes the quality and safety of the end product, and few, if any, are visible on a nutrition facts panel.
Fat quality is not a fixed property of a food category. It is the result of choices made across the supply chain. For brands and producers working in animal protein, understanding where those choices create measurable differences is where a quality story begins.
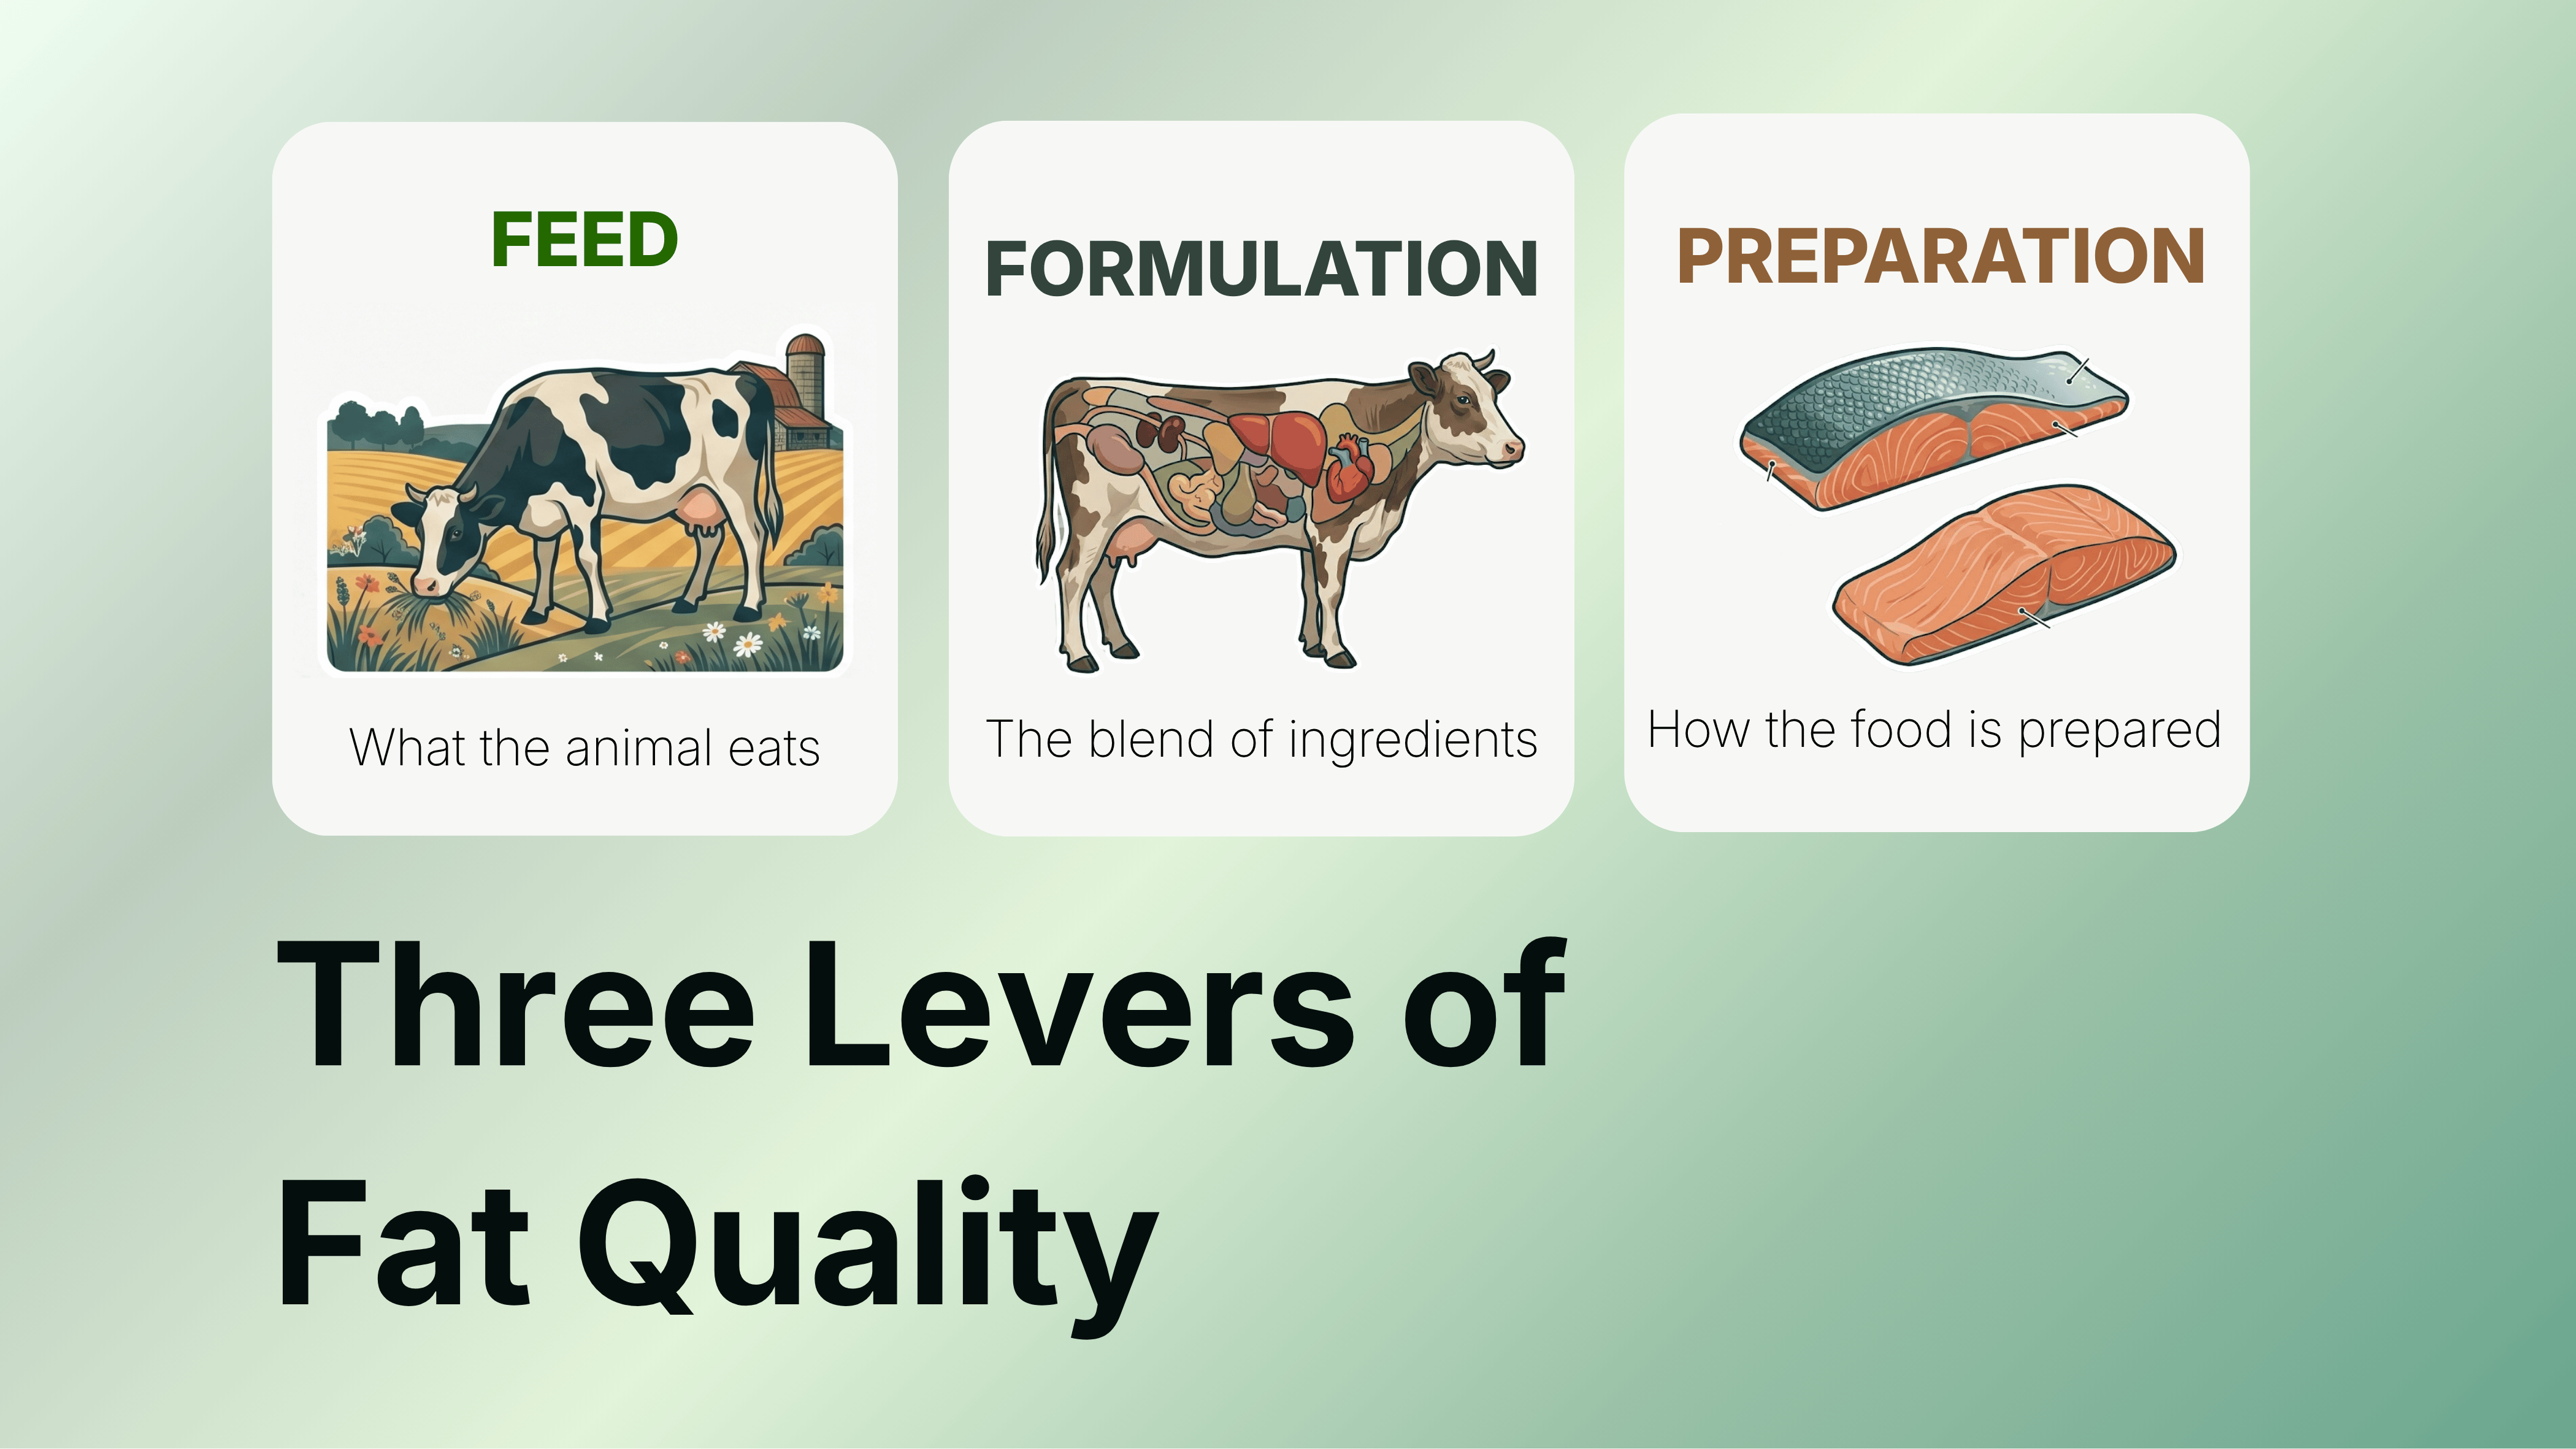
This post looks at three significant levers: the feeding system, product formulation, and preparation. After testing thousands of samples, we can confidently say that each one influences fat quality in distinct and verifiable ways.
How Feeding Systems Shape Fatty Acid Profiles in Beef
The most direct driver of fat quality in animal protein is diet. What an animal eats is incorporated into its tissue, and the fat profile of the end product reflects that input with meaningful precision.
In grassfed beef systems, Edacious data shows omega-6 to omega-3 ratios closer to 2:1. USDA reference values for conventionally finished beef sit closer to 13:1. That difference represents a fundamentally different fatty acid composition in the same food category, driven almost entirely by what the animal consumed during its life.
Grain finishing accelerates growth and increases overall fat deposition, but it shifts the fatty acid balance toward omega-6 fats. Grass and forage-based diets, by contrast, support the accumulation of longer-chain omega-3 fatty acids, including EPA and DHA in the animal's tissue. The feed becomes the fat, and the fat profile becomes the quality signal.
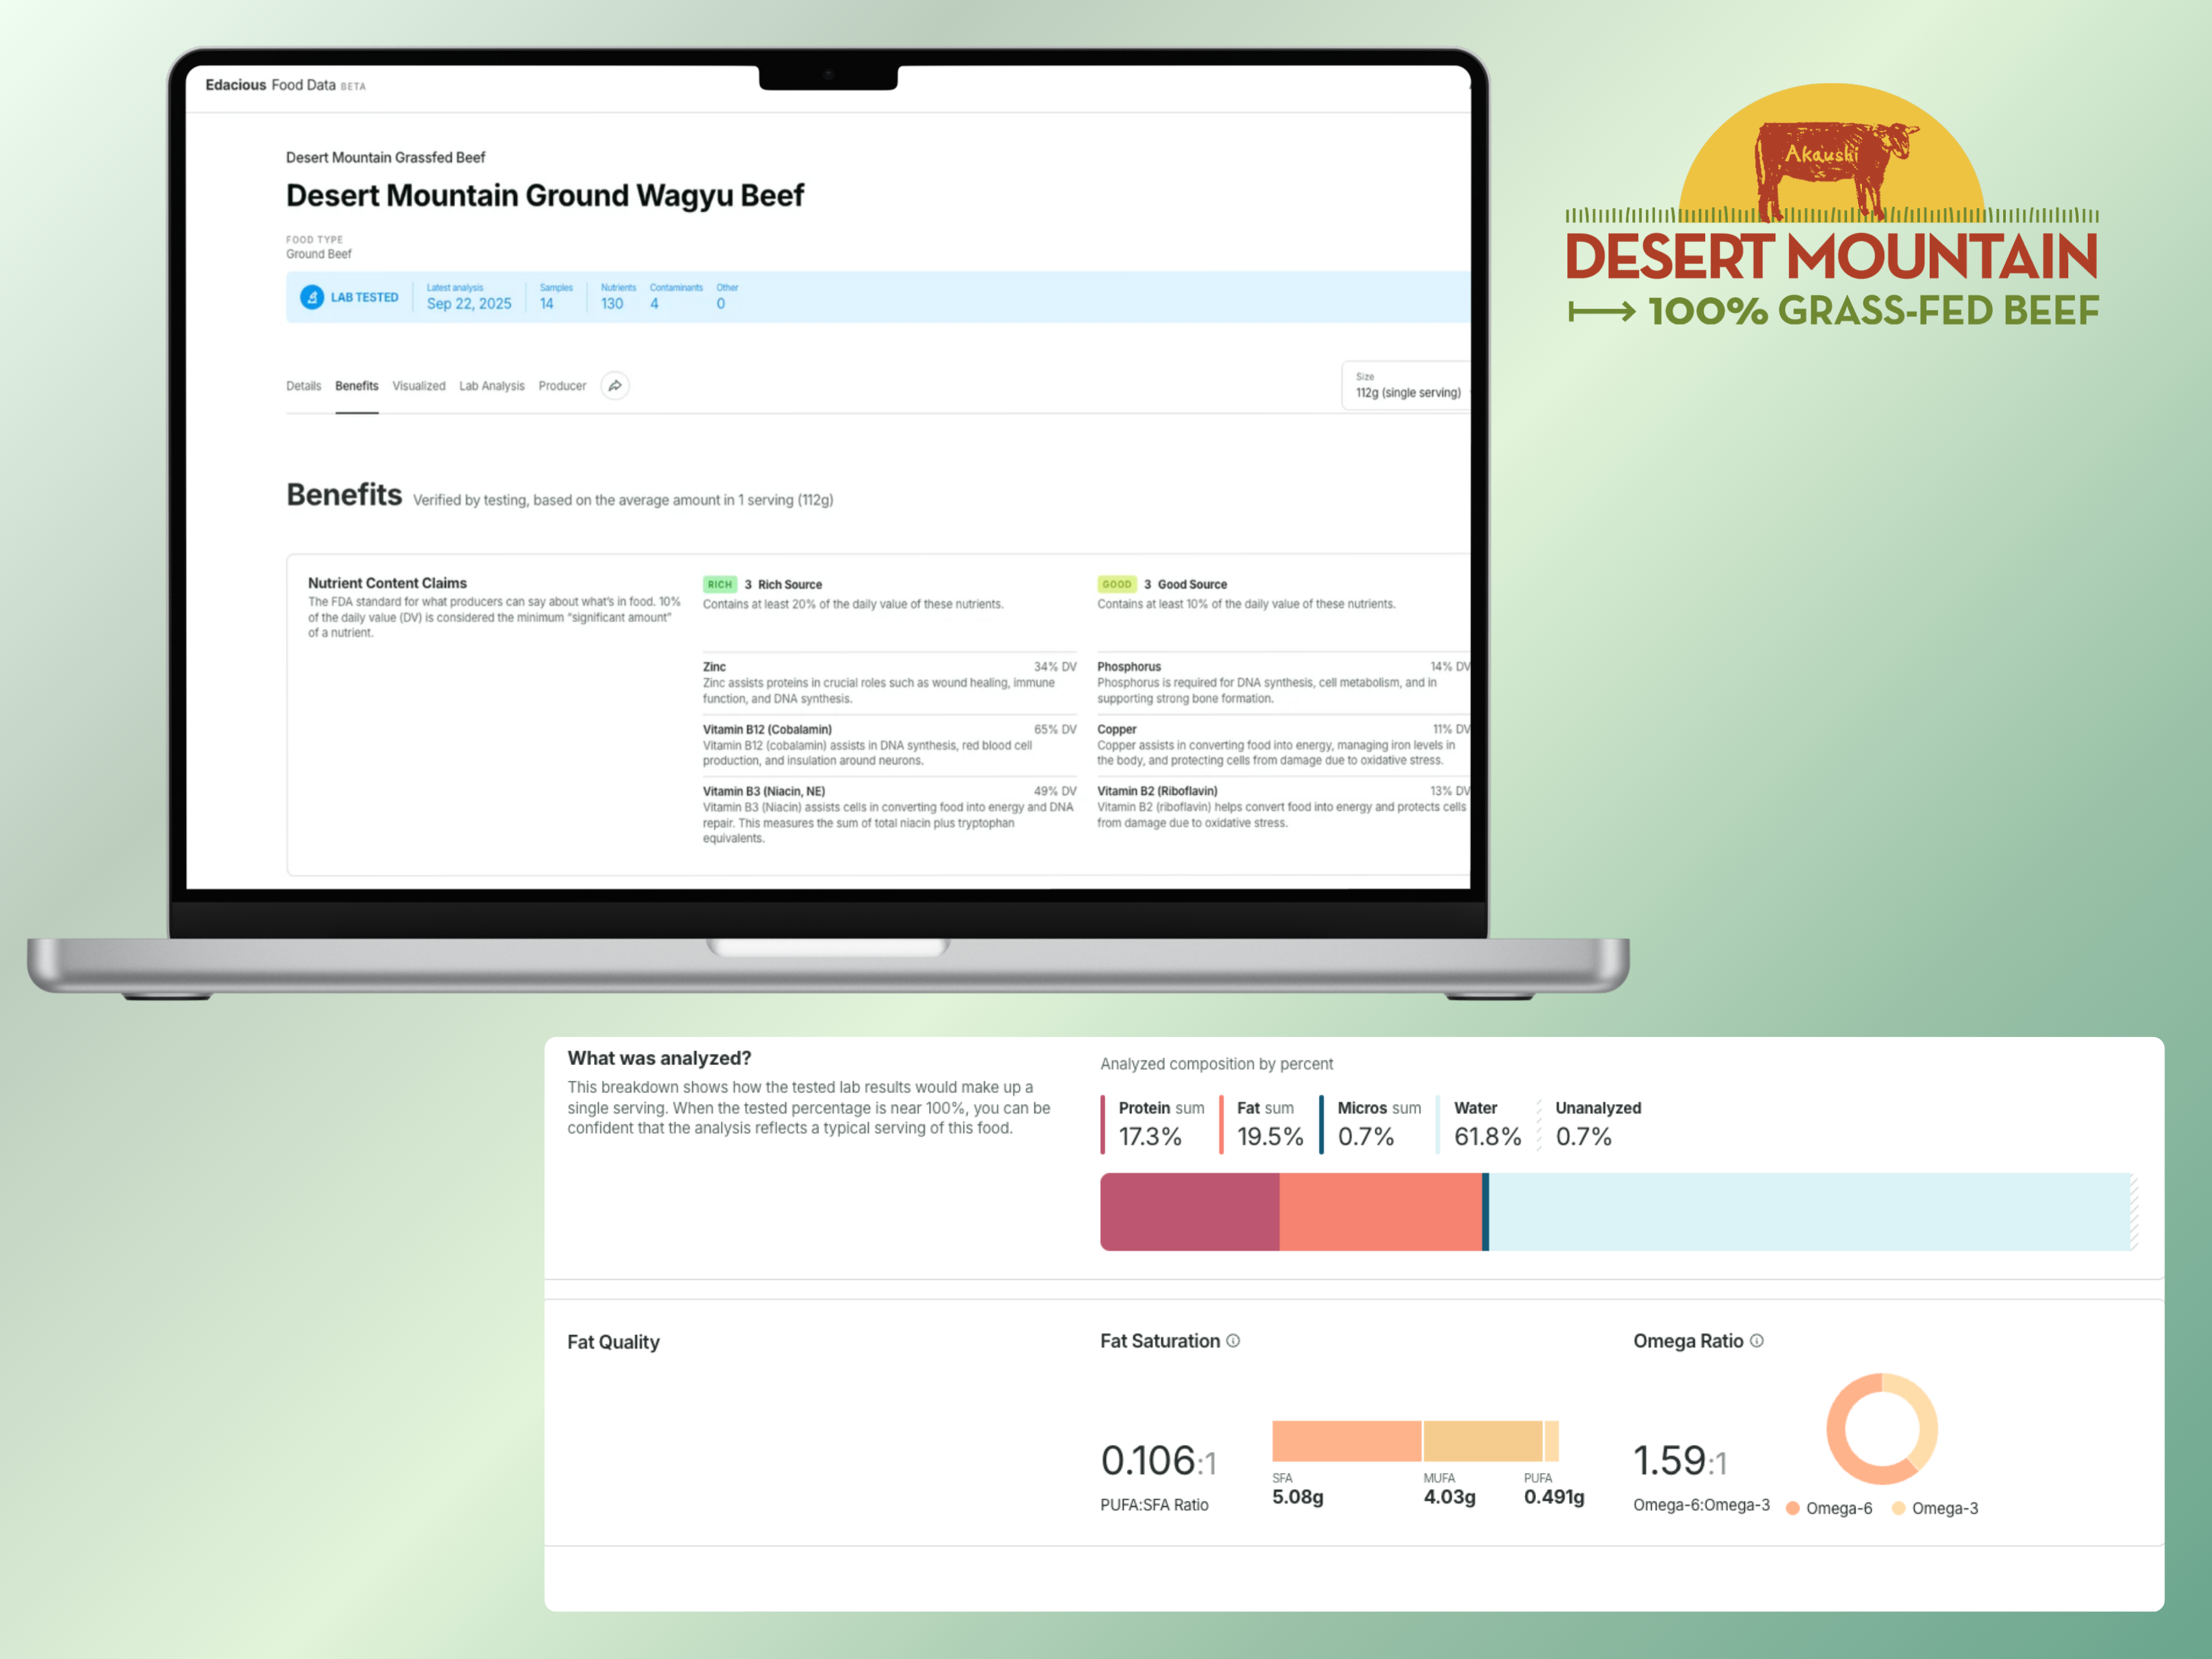
For brands sourcing grassfed or pasture-raised beef, this is one of the most defensible nutrient density claims available, provided it is supported by verified testing rather than sourcing assumptions. Two products tested through the Edacious platform illustrate this directly. Verde Farms' ribeye carries a verified nutrient profile that reflects the quality advantage of a 100% grassfed system, with Vitamin B12 at 84% DV and Vitamin E at 10% DV per serving alongside a favorable fat composition. Desert Mountain's Ground Wagyu Beef, tested across 14 samples, shows a similarly strong micronutrient profile anchored by Vitamin B12 at 65% DV, Niacin at 49% DV, and Zinc at 34% DV, all verified through lab analysis, not label assumptions.
What's notable across both is that the feeding system doesn't just change the omega ratio. It shapes the broader nutrient environment of the product.

How Product Formulation Changes the Fat Quality Picture
Feeding system is one lever. Formulation is another, and it operates independently of how the animal was raised.
Ground beef that incorporates organ meat, sometimes called an ancestral blend, shows meaningfully higher concentrations of fat-soluble vitamins, particularly vitamins A and E, alongside elevated B vitamin levels. These nutrients are stored in organ tissue and carried through the fat-rich components of the animal. Their presence in a finished product is a function of what parts of the animal are included, which is a formulation decision, not a feeding one.
This matters because fat quality is not only about omega ratios. It is also about what travels with the fat fraction of a food. Fat-soluble vitamins require dietary fat for absorption and are concentrated in fat-rich tissue. A product formulated to include organ components carries a different and measurably richer nutritional profile than one built from muscle meat alone.
For producers working with whole-animal or ancestral formulations, this is an underutilized quality signal. Force of Nature's Ground Bison Ancestral blend is a strong example of what verified testing surfaces in this category: 48% DV of Vitamin A, 33% DV of Riboflavin, and 59% DV of Niacin per serving, alongside meaningful concentrations of copper, selenium, and zinc. That nutrient profile is a direct result of the organ blend formulation, and it is the kind of data that turns a sourcing decision into a defensible claim.

How Preparation Affects Fat Retention in Fish
The third lever operates closest to the consumer, and it is the one least accounted for in standard nutrition data.
Leaving the skin on fish changes the fatty acid composition of what you consume. The fat stored in the layers closest to the skin, particularly in oily species, is concentrated in long-chain omega-3 fatty acids, including EPA and DHA. Those fatty acids are not distributed evenly through the fillet. They are densest in the fat layer that sits directly beneath the skin.
Skinless preparations have long been the default recommendation in diet culture. But that guidance assumed all fat was equivalent. For fish specifically, removing the skin removes a meaningful portion of the omega-3 content. A label built on skinless data does not reflect a skin-on product. Nutrition databases built on standard preparations undercount the EPA and DHA available in whole fish consumed as caught.
This is a preparation decision that changes a nutrient density outcome, and it is one that most existing data does not capture accurately.
Why This Matters for Brands Making Fat Quality Claims
Feeding system, formulation, preparation. Each lever shifts the fat profile of a finished product in ways that are real, measurable, and currently invisible on a standard label.
Generic databases were not built to capture this level of variability. They reflect average compositions across broad categories, not the specific profile of a product shaped by a particular feeding system, formulation approach, or preparation standard. Verified testing is what closes that gap.
Understanding how each upstream decision influences fat quality is the first step. Measuring it is what makes the story tellable and defensible.
The fat profile of your product reflects choices that were made long before the label was printed. The question is whether you have the data to prove it, and if those choices are visible to and valued by consumers.
Ready to see your product's fat quality story? Get started here.
The Fat Quality Series looks beyond total fat to understand how fat quality varies across foods and production systems. We explore omega balance, fatty acid profiles, and why how fat is produced often matters more than how much is present.